DBTMEE Help
- What is 'DBTMEE'?
- What are the differences between Version 1.0 and Version 2.0?
- Why are there so many tables? And what are they?
- I do not know what a table name means (e.g. 'SPR_Methy_Kobayashi_+-5KfromTSS'). How do I check it?
- How do I access DBTMEE records?
- How do I use the advanced option?
- How do I get the results as Excel file?
- What does "enrich" mean in ChIP-seq data of Histone modification?
- I have taken a look at a gene categorized into 4-cell transient pattern. But, its FPKMs was not 4-cell transient. Why?
- I want to see a network of TF-Promoter interaction
- I want to share information on which TFs potentially bind to which genes
- I cannot play Flash on my web-browser. What is the web-browser recommended?
- How do I download the original data file?
- How do I get genes in "Maternal RNA" category from the downloaded file?
- How do I get the raw data file for expression clustering?
- Data access
- Abbreviations
What is 'DBTMEE'? [⇑]
DBTMEE (Database of Transcriptome in Mouse Early Embryos) is a free database designed to manipulate gene expression information from our ultralarge-scale whole-transcriptome analysis of mouse early embryos (Genes Dev. 2013). Since integrative approaches with multiple public analytical data have become indispensable for studying embryogenesis due to technical challenges such as biological sample collection, we combined the gene expression profile with various public resources. Thereby, users can extensively investigate molecular characteristics among totipotent, pluripotent, and differentiated cells while taking genetic and epigenetic characteristics into consideration. DBTMEE will help to promote our understanding of the enigmatic fertilization dynamics.
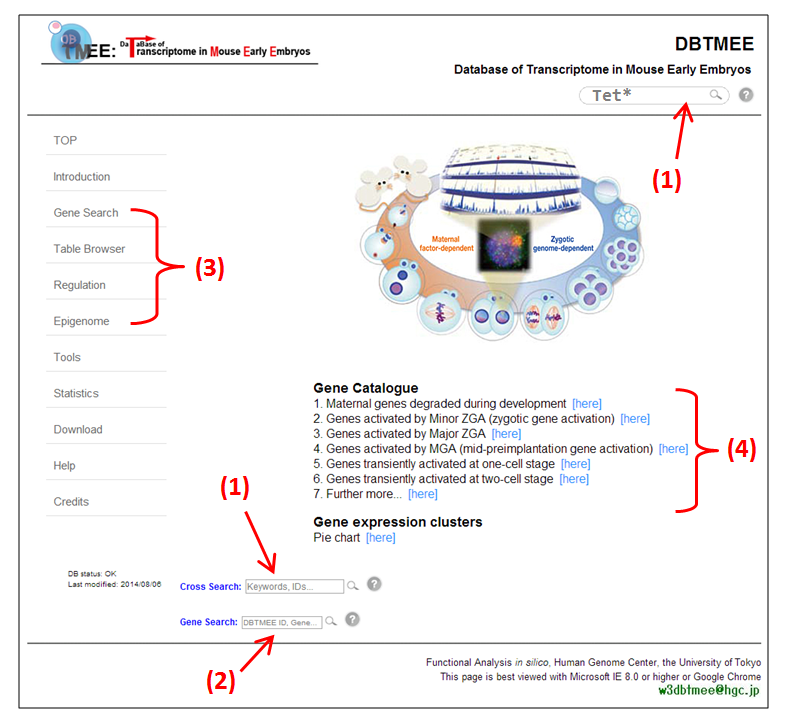 [click the image for high resolution]
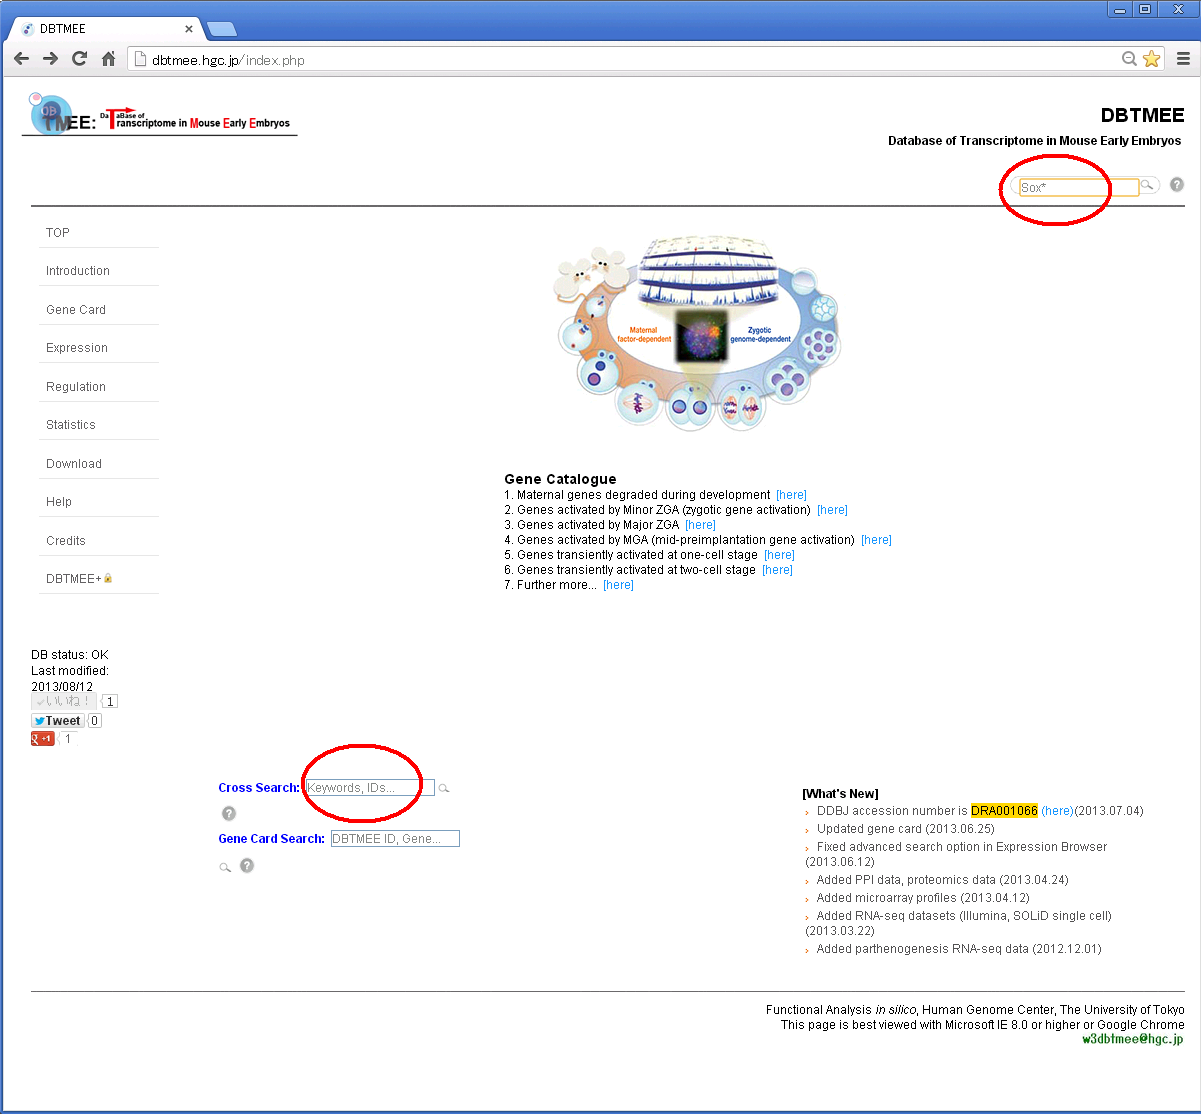
In the front page of DBTMEE (Figure above), we provide search boxes (1 and 2) and table browsers (3). DBTMEE contains ten gene expression clusters (4) identified by a hierarchical clustering method (see this).
What are the differences between Version 1.0 and Version 2.0? [⇑]
Version 1.0 (v1.0) is the dataset originally used in our published paper (Genes Dev. 2013). In this paper, we used RefSeq annotation (downloaded on 2011.03.07) and TopHat (version 1.4.1)-Cufflinks (version 2.0.2) pipeline. In the updated version (v2.0), we re-assembled RNA-seq data using Cufflinks package version 2.2.1 with RefSeq annotation downloaded on 2014.06.23 (RefSeq Release 65). Moreover, version 2.0 includes RNA-seq data of ES- and iPS-cells published at [PUBMED].
Note that DBTMEE IDs less than 2000000 is for v1.0, but greater than it is for v2.0.
Why are there so many tables? And what are they? [⇑]
DBTMEE contains other public resources to systematically understand male and female genome dynamics from fertilization to ZGA. "Statistics of DBTMEE" states the descriptions for all the tables. In our database, one RNA-seq data has three tables,
"gene_guided" means that Tophat-Cufflinks pipeline [PUBMED] used RefSeq transcript information. The pipeline aligns and assembles sequenced reads for each of all replicates. This procedure outputs the number of mapped reads and FPKM (fragments per kilobase of transcript per million fragments mapped) for genes in each replicate (i.e. [A] and [B]), which provide evidence of reproducibility of RNA-seq experiments. Next, Cuffcompare merges all the transcript assemblies and Cuffdiff calculates FPKMs across all replicates based on the merged transcript assembly (i.e. [C]). These FPKMs are slightly different between A-B-C and A-B(or A-B-C-D) stage combinations. For these reasons, we created tables with various combinations of cell stages and annotations. In the updated version (V2.0), RNA-seq datasets of all cell types (Sperm, Oocyte to 4-cell stages, ES-cell, MEF, parthenogenetic 1- and 4-cell stages, iPS-cell) are analyzed and quantified at once (ALL-IN-ONE).
I do not know what a table name means (e.g. 'SPR_Methy_Kobayashi_+-5KfromTSS'). How do I check it? [⇑]
"Statistics of DBTMEE" explains about each table, including a link to the original publication.
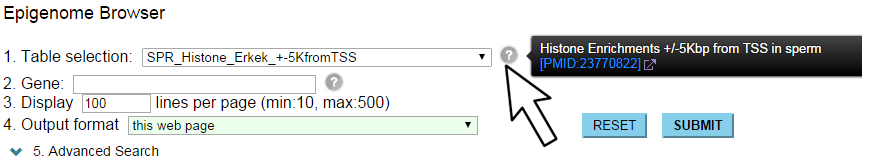
If you see a drop-down list for "Table selection", hovering of the mouse cursor on "?" icon will show a description for the current table.
Please, refer (or contact us) to the original publications for more detailed information.
How do I access DBTMEE records? [⇑]
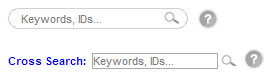 You can enter gene symbols, RefSeq IDs, and/or DBTMEE IDs in two search boxes of "cross search" located at top-right panel and the bottom-left corner in the front page. The given keywords are searched from Genes, Synonyms, RefSeq, and DBTMEE ID fields in 'TMEE_GENE' table, but searched only from Genes field in other tables. So, if your keyword is a synonym, you cannot get any hits from tables, exepting 'TMEE_GENE'.
You can use multiple keywords separated by a space:
For example, Step 1: Enter "Sox*" in the search box and then press Enter.
Step 2: You will get a result page with accordion tabs like this.
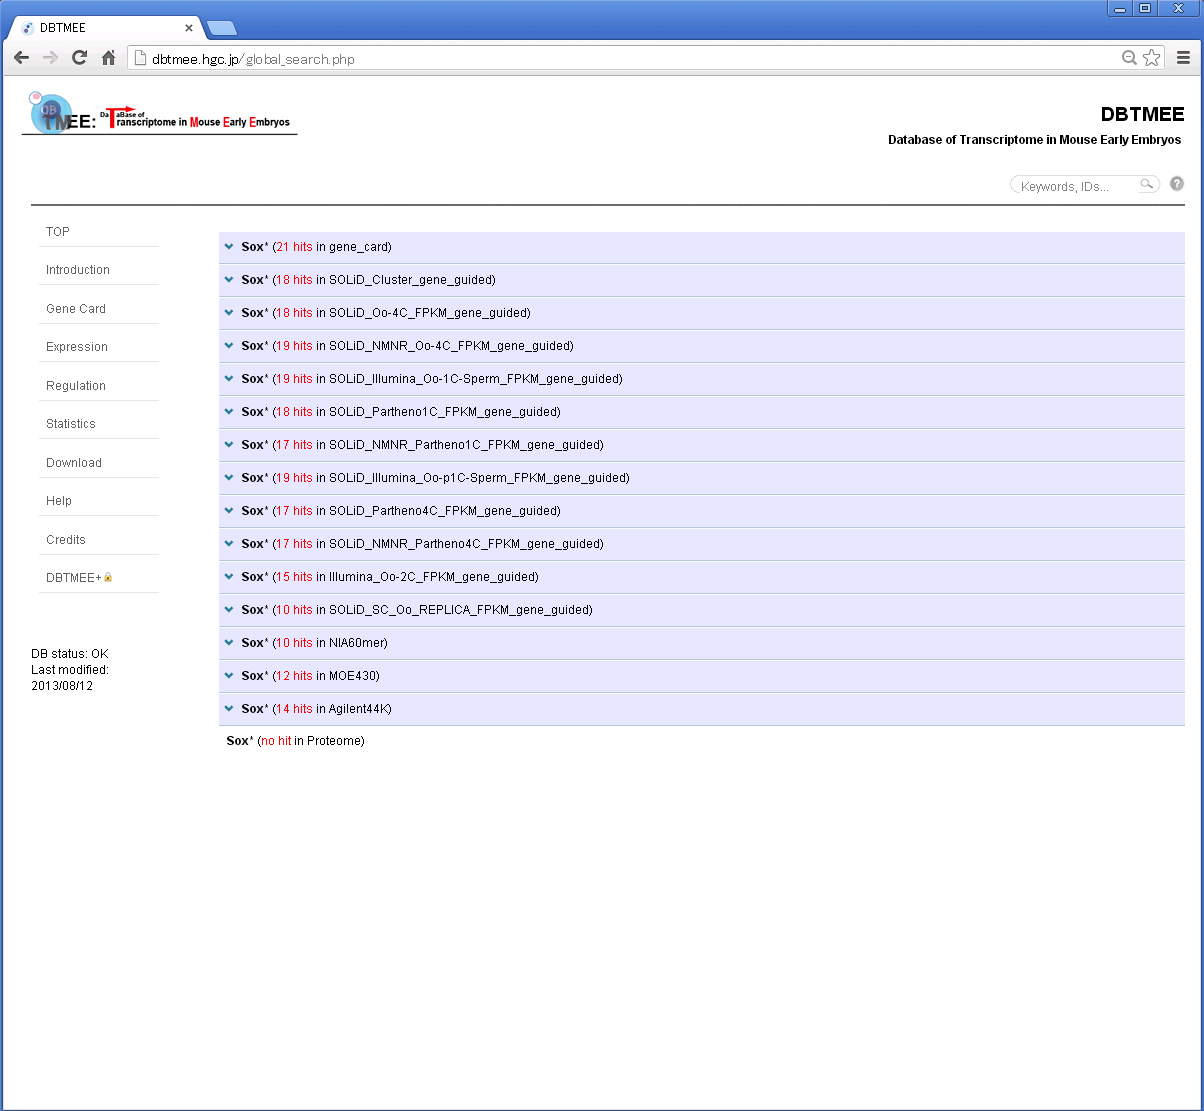
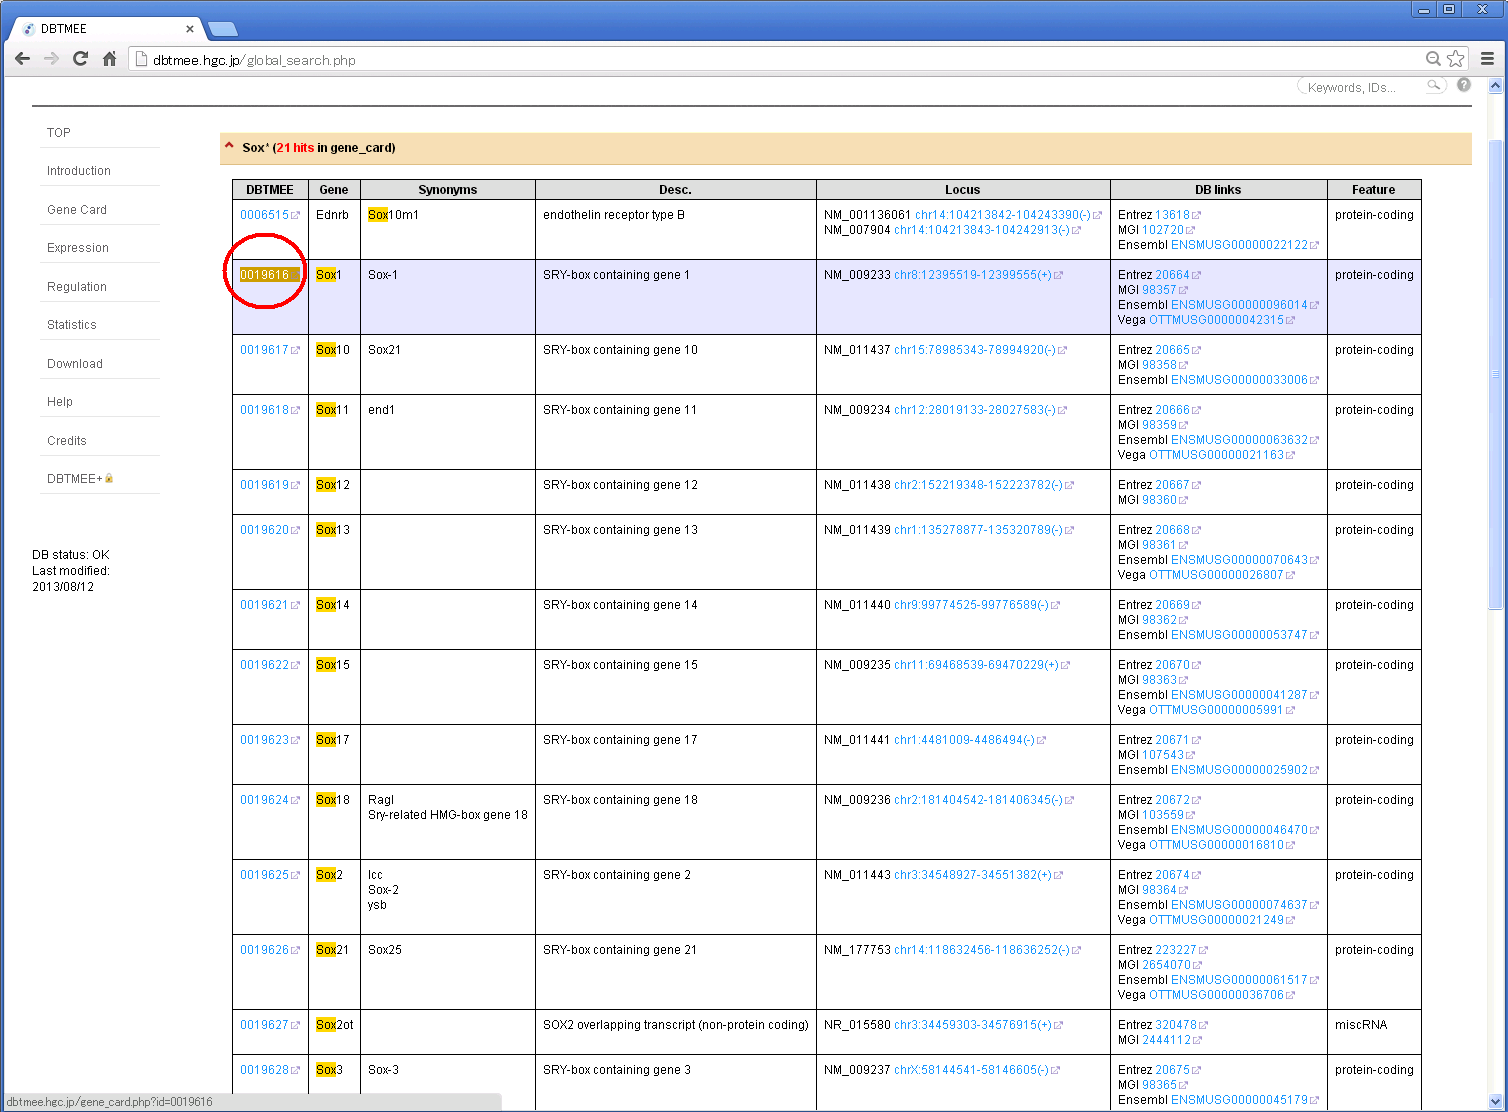
Step 3: Click 'TMEE_GENE' tab and find your interest (e.g. '0019616'). Then, click the DBTMEE ID.
Other tabs will show your hits from other tables.
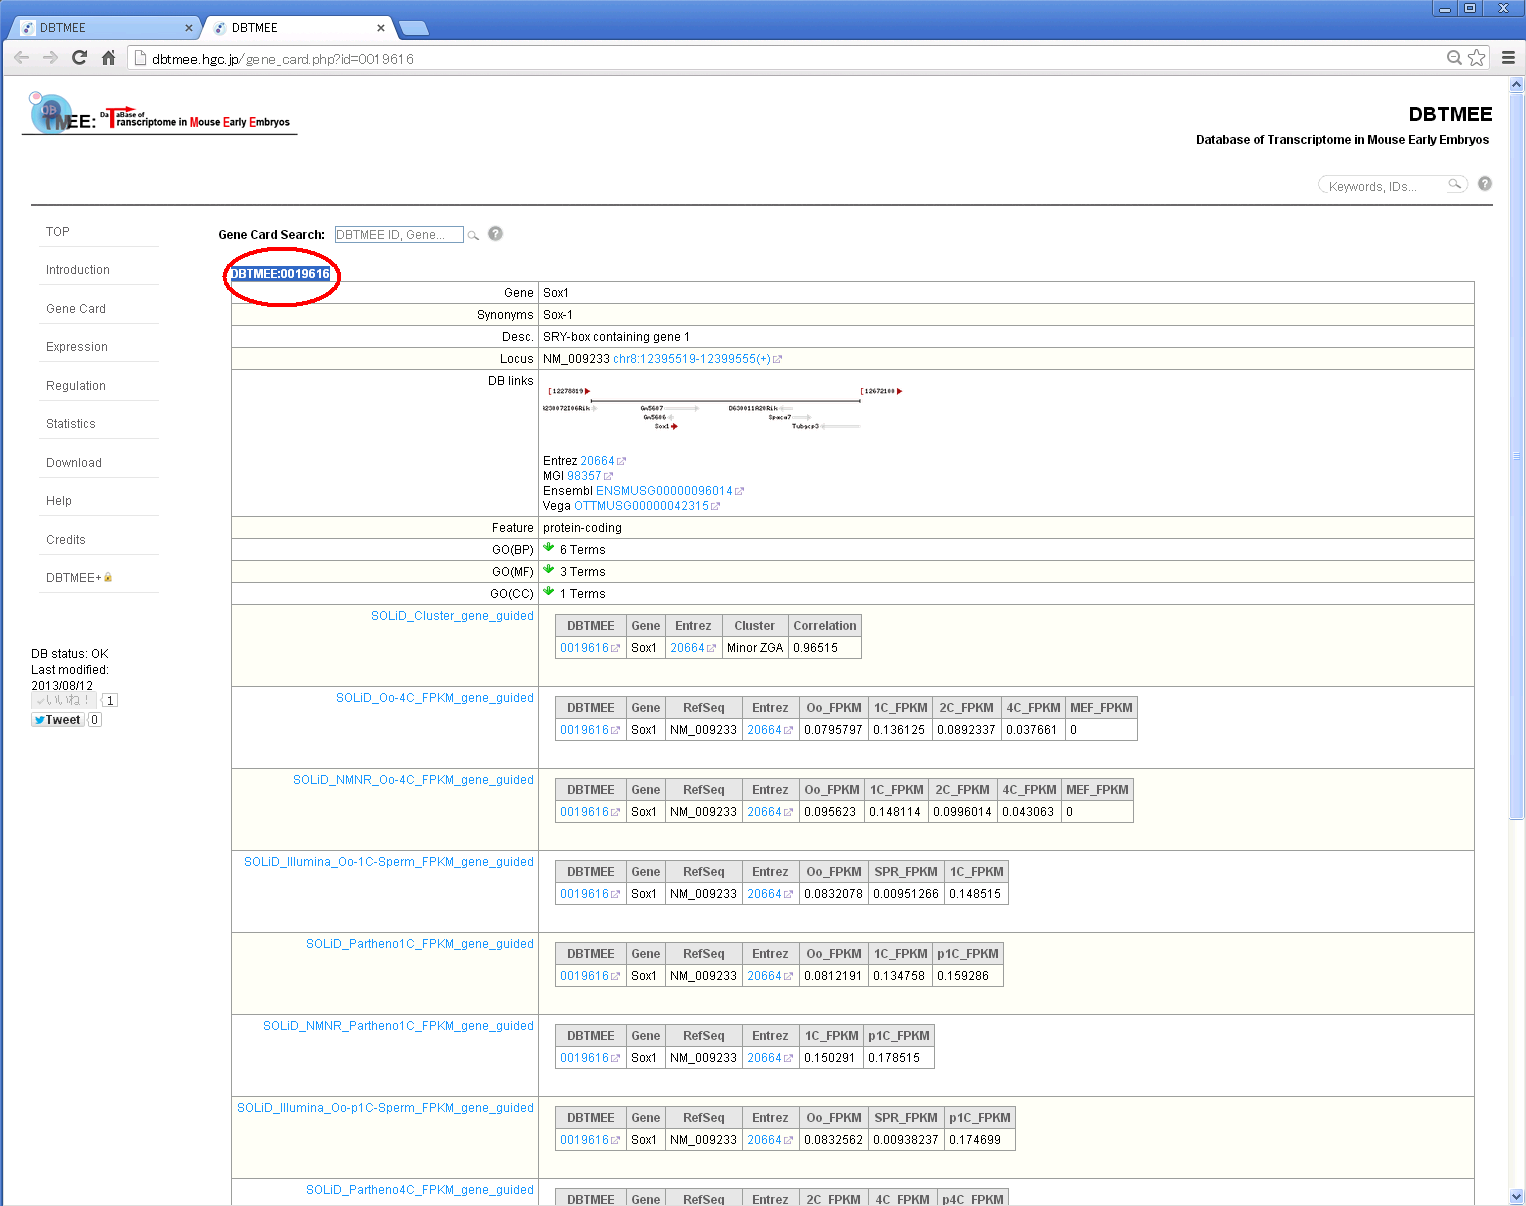
Step 4: You will see a dbtmee gene that summarizes the gene information and contents of DBTMEE tables.
How do I use the advanced option? [⇑]
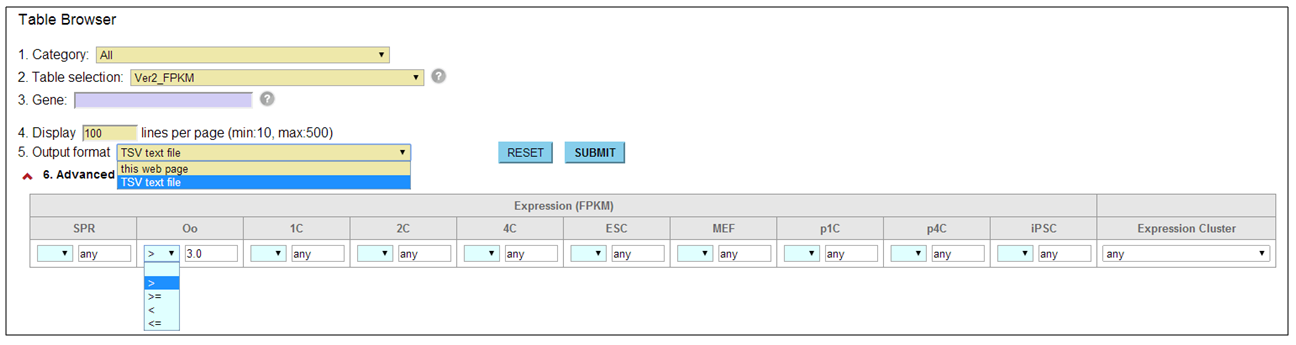
In the browser interfaces, we equipped the basic and advanced search options that enable users to handle more specific search results. For example, in the Table Browser, users must enter keywords into the '3. Gene' field after selecting a table from the '2. Table selection' field. The '1. Category' field helps to focus the search on tables in a particular category. To download the search result, users have to select 'TSV text file' from the '5. Output format' field. In the epigenome browser, this field contains an extra option 'TSV+Gene expression (V2.0)' that serves both epigenetic features and gene expression levels in one text file.
The content of advanced options that is combined by AND search operator is dynamically changed corresponding to a table user selected. For example, in the case of tables for gene expression profiles, user can set thresholds for FPKMs and confine genes that exhibit a specific expression pattern.
How do I get the results as Excel file? [⇑]
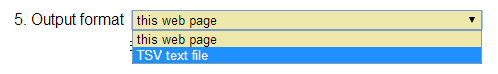 When you submit a query, select "TSV text file" from the full-down menu of "Output format". This option returns a tab-separated text file that allows you to import it to Excel sheet.
What does "enrich" mean in ChIP-seq data of Histone modification? [⇑]
Histone enrichment score of ChIP-seq data (i.e. "enrich") for a gene promoter (+/- 5Kbp or +/- 2Kbp) is calculated by
- ChIP H3.3_1: 124,724,897
- CTRL H3.3_1: 87,413,752
- ChIP H3.3_2: 94,745,726
- CTRL H3.3_2: 87,413,752
- ChIP H3K4me3_1: 7,203,609
- CTRL H3K4me3_1: 87,413,752
- ChIP H3K4me3_2: 34,739,482
- CTRL H3K4me3_2: 87,413,752
- ChIP H3K27me3_1: 20,995,404
- CTRL H3K27me3_1: 87,413,752
- ChIP H3K27me3_2: 132,434,879
- CTRL H3K27me3_2: 87,413,752
I have taken a look at a gene categorized into 4-cell transient pattern. But, its FPKMs was not 4-cell transient. Why? [⇑]
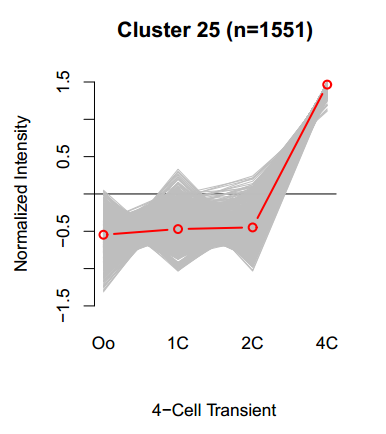
[gray line: relative FPKMs of a gene, red line: mean of the cluster]
We clustered over 17,000 genes into 25 groups using a hierarchical clustering method (see this). Each of clusters contains genes (gray lines) most likely to be similar to the cluster mean (red line), but this allows deviation from the cluster mean. We are showing 'Corr.' (or 'Corr_to_Cluster_Mean') indicating how a gray line is correlated with the red line. So, users can pick up genes well correlated with the specific pattern.
I want to see a network of TF-Promoter interaction [⇑]
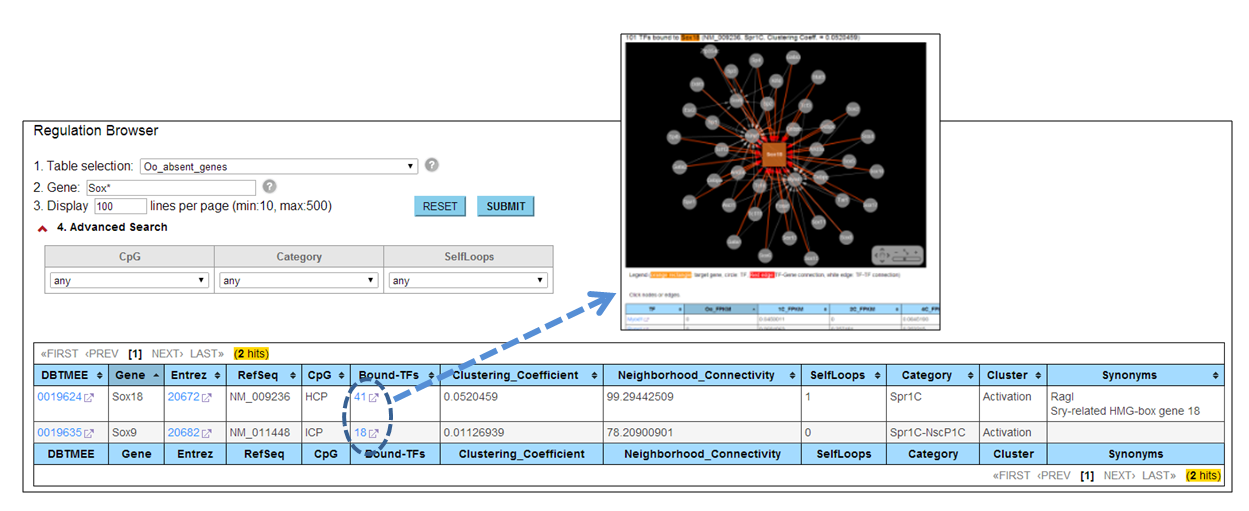
Through the 'Regulation' browser, users can search genes of interest. The genes are de novo transcription immediately after fertilization (i.e. not detected at Oocytes). The browser provides the 'Bound-TFs' column. If users click a number in this column, a web page visualizing a TF-Gene interaction appears with a list of TFs binding to this gene promoter. Detail information can be found at Genes Dev. 2013.
I want to share information on which TFs potentially bind to which genes [⇑]
The 'Regulation' browser provides a table (108_Tfs_targeting_Oo_absent_genes) that lists TFs and their target genes that were not detectged at Oocytes.
Genes were grouped into six clusters (Table 3. in [PUBMED]);
- Nsc1C (Nascent-1C): genes expressed at 1C only (not expressed at Oocyte and p1C).
- Spr1C (Sperm-1C): genes expressed at Sperm and 1C (not expressed at Oocyte and p1C).
- Nsc1C-NscP1C (Nascent-Common): genes expressed at both 1C and p1C. "Common" represents 1C and p1C (not expressed at Oocyte and Sperm).
- NscP1C (Nascent-p1C): genes expressed at p1C only (not expressed at Oocyte and 1C and Sperm).
- Spr1C-NscP1C (Sperm-Common): genes expressed at Sperm and 1C and p1C (not expressed at Oocyte).
- SprP1C (Sperm-p1C): genes expressed at Sperm and p1C (not expressed at Oocyte and 1C).
P-value in this table indicates statistical significance of Jaspar motif enrichment (See the method section in [PUBMED]).
I cannot play Flash on my web-browser. What is the web-browser recommended? [⇑]
We tested DBTMEE web pages with Microsoft IE 11, Google Chrome 37, and FireFox 32 that have installed Adobe Flash Player (ver. 15.0.0.152). To fully access DBTMEE contents, users should use one of these browsers. Javascript must be enabled in your browser in order to function as designed. We will replace Cytoscape to Cytoscape JS in the next release of DB.
How do I download the original data file? [⇑]
Please, visit Download page and click [DL] in the "All tables used in DBTMEE" section.
This compressed file provides Tables in the TAB-delimited text format.
How do I get genes in "Maternal RNA" category from the downloaded file? [⇑]
For example with the Version1; i.e. without ESC, iPSC, you need
1. cluster_gene_v1.tsv
2. PARK/RNASEQ_MM9_gene_expression.fpkm.tsv
To pick up gene IDs that >3 FPKMs at all stages & >0.75 correlation to the cluster mean of "Maternal RNA",
## Step 1-1: To confirm gene numbers and correlations to the cluster mean value
%>grep -w "Maternal RNA" cluster_gene_v1.tsv | sort -t$'\t' -nk 6
%>grep -w "Maternal RNA" cluster_gene_v1.tsv | wc -l
## Step 1-2: To get DBTMEE IDs (or gene symbols) over corr >0.75
%>grep -w "Maternal RNA" cluster_gene_v1.tsv | awk -F "\t" '{if($5>0.75){ print $1}}' > maternal_V1.txt
(resulting in 4241 genes)
(If you need gene symbols instead of DBTMEE IDs, change $1 to $2)
## Step 2: To get genes by filtering expression levels (e.g. >3 FPKMs in Oocyte, 1-cell, 2-cell, and 4-cell stages)
%>grep -v "_FPKM" PARK/RNASEQ_MM9_gene_expression.fpkm.tsv | awk '{ if($5>3 && $6>3 && $7>3 && $8>3){ print $1}}' > genes_fpkm3.txt
## Step 3: To get IDs categorized into "Maternal RNA",
%>cat maternal_V1.txt genes_fpkm3.txt | sort -k 1 | uniq -d > result_MaternalRNA_geneIDs.txt
(resulting in 941 IDs)
How do I get the raw data file for expression clustering? [⇑]
Please, visit Download page and click [DL] in the "raw data of clustering" section.
This compressed file provides the data set used in expression clustering, and includes the results also.
Data access [⇑]
RNA-seq data generated in here have been deposited in the DDBJ Sequence Read Archive (DRA) under accession number DRA001066.
DB tables and other resources are available at download page.
Abbreviations
[top]